As a public service, here’s a list I encountered this morning, set in the context of data.
Enjoy.
And reuse, link, etc.
“Lowest unemployment rate amongst African Americans and the Spanish community since it's been tracked.”
Those numbers are continuations of trends that were running for the last 5 years of Obama’s presidency.
 |
| https://fred.stlouisfed.org/graph/fredgraph.png?g=kwnF |
 |
| https://fred.stlouisfed.org/graph/fredgraph.png?g=kwnO |
And the employment-population ratio for both groups is still below what it was in 2007, and far below what it was in 2009.
 |
| https://fred.stlouisfed.org/graph/fredgraph.png?g=kwnV |
 |
| https://fred.stlouisfed.org/graph/fredgraph.png?g=kwod |
“Lowest unemployment rate for woman in 66 years.”
I assume you mean “women,” and not some one individual “woman” who’s got her best numbers in 66 years.
Again, it’s the continuation of a trend that has been in place since November, 2010.
 |
| https://fred.stlouisfed.org/graph/fredgraph.png?g=kwoZ |
And as with Latinos, the employment-population ratio for women is still far below what it was in 2007.
 |
| https://fred.stlouisfed.org/graph/fredgraph.png?g=kwp8 |
“Over 260 records on both U.S. exchanges adding in excess of 1.4 Trillion dollars. The public and investor corps finally seeing a return on investment which directly affects retirees and those with 401k's, who are finally seeing a return after a decade.”
Source?
And what do you mean “both” U.S. exchanges? There are three major ones: NYSE, Nasdaq, and AMEX. Perhaps you meant the two major indexes: Dow Jones and S&P 500. At any rate, a source would be real helpful to help us understand what you mean here.
And to the underlying data, the thing about stock markets is that they usually go up. If you set a record on one day, and then have 9 more good days, that’s 10 records right there. Nothing remarkable about it.
Looking at the S&P as an example, during Trump’s administration, the S&P has hit a record on 75 days out of 539 that he’s been in office. The same index hit a new record on 258 days out of the 2,922 that Obama was in office. If we start counting from the market bottom on March 9, 2009, then Obama had 258 S&P highs over 2,874 days.
 |
| https://fred.stlouisfed.org/graph/fredgraph.png?g=kws6 |
But if you look at overall gains, from March 9, 2009, to the end of Obama’s term, the S&P gained at an annualized rate of 16.6%. Since Trump took over, the S&P has gained at an annualized rate of 15.4%.
“Consumer confidence index highest it's been in 17 years.”
Which index are you talking about? The University of Michigan Consumer Sentiment numbers?
In March, that index did indeed reach its highest level since January, 2004 (which is a little more than 14 years, not 17). The April and May numbers were off a bit, but that’s probably not meaningful, as there’s a lot of “noise” month to month. The underlying trend is still upward.
 |
| https://fred.stlouisfed.org/graph/fredgraph.png?g=kjZi |
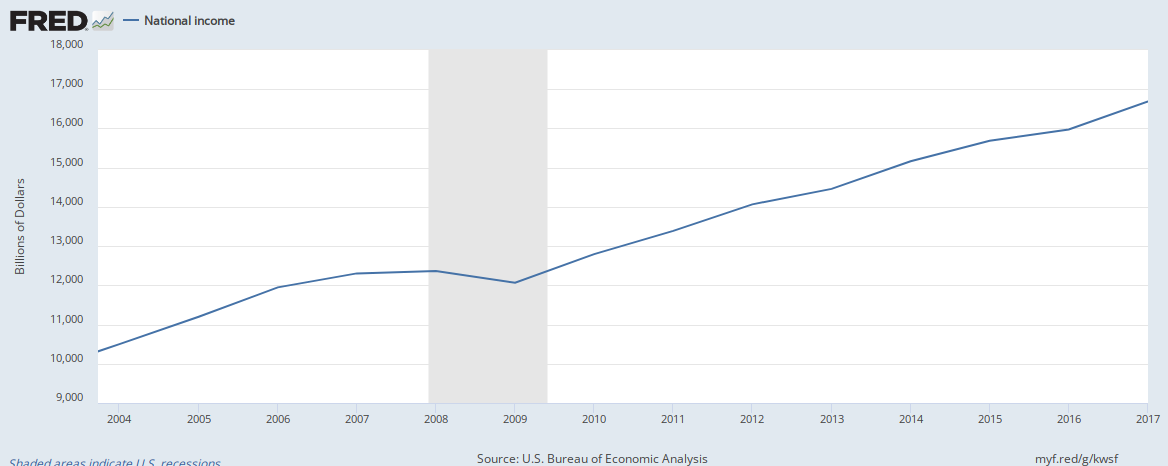
“Income inceases for the first time in 30 years.”
You’re really going to have to clarify this. “Income” can refer to a lot of things in economics.
Do you mean “Real median household income”? That’s a pretty useful measure of how the typical household is doing. The data are annual and the 2017 numbers haven’t yet been released, but the 2016 number was a new high, and the trend was upward after 2012.
 |
| https://fred.stlouisfed.org/graph/fredgraph.png?g=g0Yv |
 |
| https://fred.stlouisfed.org/graph/fredgraph.png?g=kwsf |
“Home ownership up after 9 years.”
Again, it would be helpful if you were more specific about the statistic to which you’re referring. The home ownership rate fell for 12 years, from Q2 2004 to Q2 2016. Note that Obama inherited a downward trend that continued almost all the way through his presidency, before turning around just before he left office.
 |
| https://fred.stlouisfed.org/graph/fredgraph.png?g=jCht |
Home ownership is good, all else being equal. But if it’s being pumped up by bubble finance, it’s unsustainable. What happened in the second half of GW Bush’s presidency and most of Obama’s was arguably a return to a level that better fits with people’s incomes. That correction burned itself out, and now you want to give Trump credit for the U.S. maybe having a normal housing market again.
“Workforce participation is DIRECTLY related to choice. Sorry, but the Millennials choose to live of their parents.”
Obviously workforce participation is a choice, but it’s a choice made under particular conditions. If it’s hard to find work that pays well enough to cover childcare, then “choosing” not to participate is rational.
Besides, do you have any evidence for your explanation that the low rate is Millennials choosing to live off their parents?
Here’s the participation rate for ages 25-54:
 |
| https://fred.stlouisfed.org/graph/fredgraph.png?g=kwtJ |
Second, it stabilized in late 2013 and has been improving since early 2016. The definition of “Millennials” is vague, but by any definition, they’re playing a more and more prominent role in the 25-54 group as time goes on. If the problem is really Millennials choosing to mooch off their parents, why is this statistic continuing to (modestly) improve as Millennials come to constitute a greater part of the pool?
“Illegal border crossing down 30%”
Source?
Apprehensions on the southwestern border do seem to be down to their lowest level in 17 years, but again, this is a trend that has been in place since 2001, and it was accelerated by the recession in 2008-09: why take the risk of crossing into the U.S. illegally if the employment prospects are no longer as good as they used to be?
There does seem to be an additional decline, due to a mix of Trump’s rhetoric and his policies, but again, you stand on the shoulders of a long trend and claim that your guy did it. Pathetically predictable.
“Food stamps usage down for the first time in 40 years.”
Source?
Do you mean the number of people on food stamps? That seems to have fallen from 1994 to 2000, then again from 2013 to today.
 |
| http://www.trivisonno.com/food-stamps-charts, based on USDA data |
Do you mean the percentage of the population using food stamps? That seems to have fallen from 1995 to 2001, then again from 2013 to today.
 |
| http://www.trivisonno.com/food-stamps-charts, based on USDA data |
In short, not much to the list of claims.
This comment has been removed by a blog administrator.
ReplyDelete